GBP/USD Technical Analysis: Cable nearing 1.2720 target ahead of Brexit vote
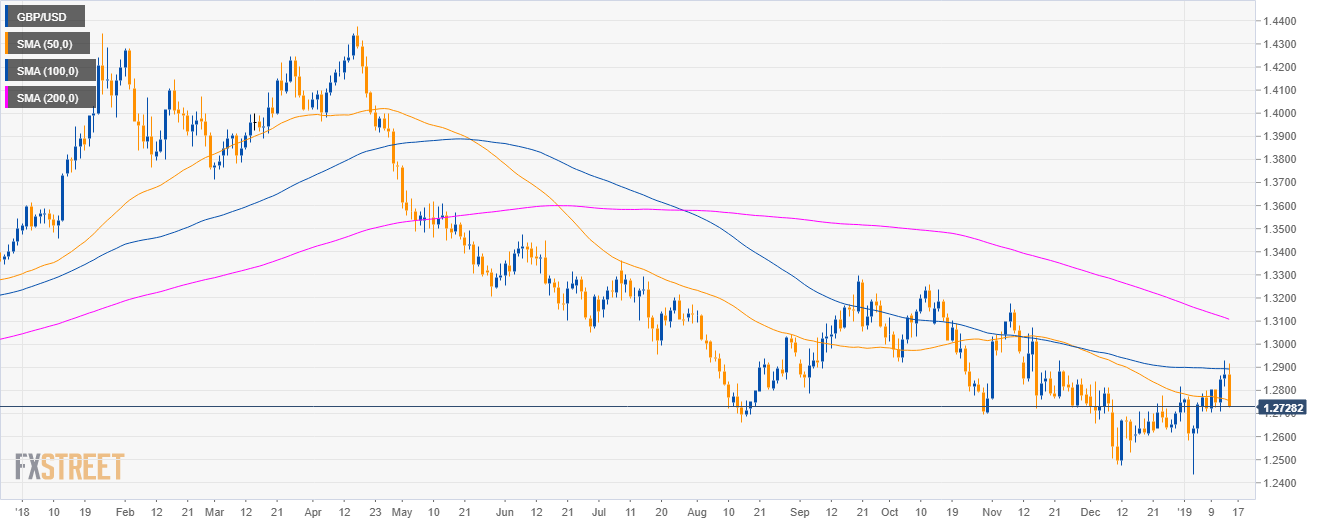
GBP/USD daily chart
- GBP/USD is trading in a bear trend below its main simple moving averages (SMAs).
- The Brexit vote at 20.00 GMT is likely to lead to high market volatility.
- The 1.2800 target has been achieved.
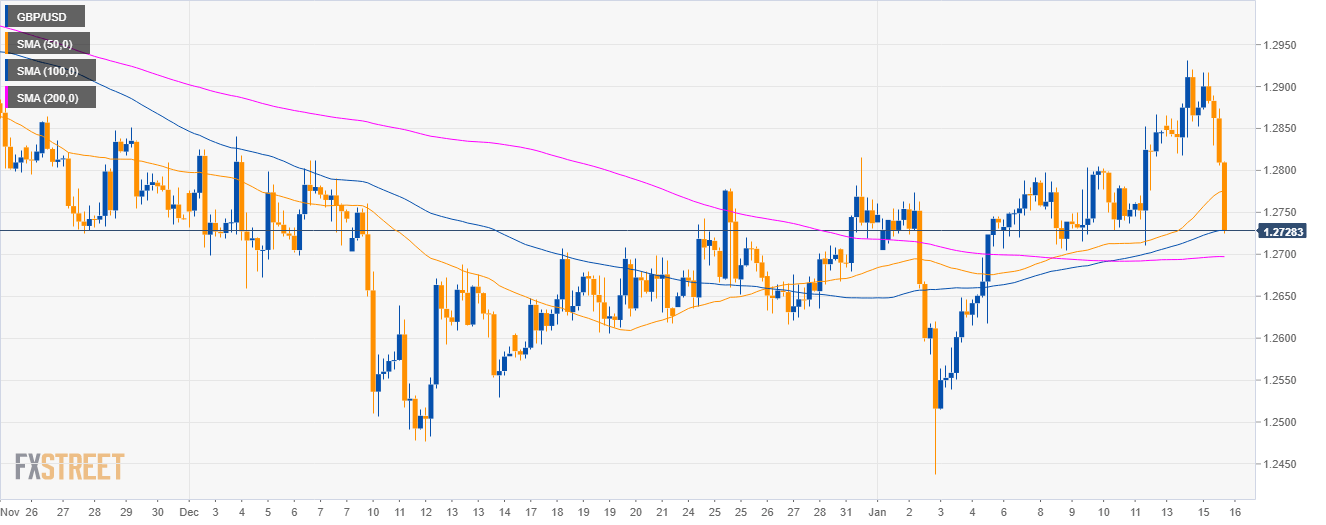
GBP/USD 4-hour chart
- GBP/USD is trading below the 50 SMA.
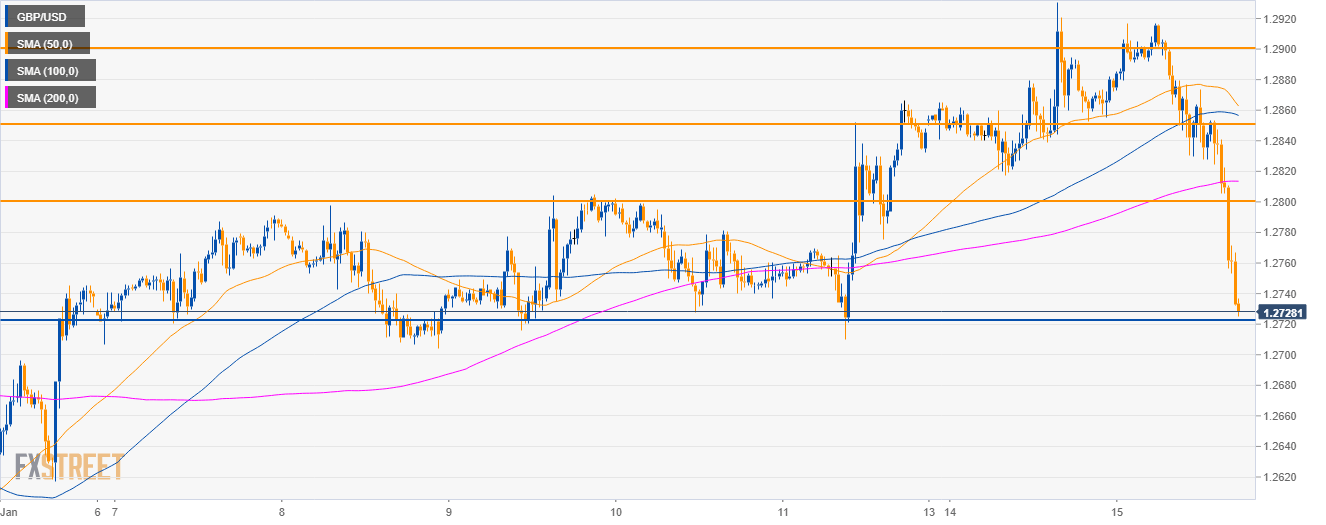
GBP/USD 30-minute chart
- Bears are only a few pips away from the 1.2720 target.
Additional key levels
GBP/USD
Overview:
Today Last Price: 1.2729
Today Daily change: -1.4e+2 pips
Today Daily change %: -1.08%
Today Daily Open: 1.2868
Trends:
Previous Daily SMA20: 1.2708
Previous Daily SMA50: 1.2763
Previous Daily SMA100: 1.2893
Previous Daily SMA200: 1.3118
Levels:
Previous Daily High: 1.2931
Previous Daily Low: 1.2818
Previous Weekly High: 1.2866
Previous Weekly Low: 1.2704
Previous Monthly High: 1.284
Previous Monthly Low: 1.2477
Previous Daily Fibonacci 38.2%: 1.2888
Previous Daily Fibonacci 61.8%: 1.2861
Previous Daily Pivot Point S1: 1.2813
Previous Daily Pivot Point S2: 1.2759
Previous Daily Pivot Point S3: 1.27
Previous Daily Pivot Point R1: 1.2926
Previous Daily Pivot Point R2: 1.2985
Previous Daily Pivot Point R3: 1.304