USD/JPY Price Analysis: Stalls at key technical level, retraces towards 146.00
- USD/JPY seesawed in a wide range, though it remains unable to stay in the green, losing 0.15%.
- The daily chart keeps buyers in charge, though the USD/JPY might pull back before testing YTD highs.
- Short-term, the USD/JPY is neutral-downward biased, and once it clears the 200-EMA, it could fall below 144.00.
The USD/JPY stalled at the 20-day Exponential Moving Average (EMA) at around 146.90 and tumbled toward its daily low of 145.10 before recovering some ground. Nevertheless, the USD/JPY continued to trade in the red, at 146.12, down by 0.14% amidst a volatile session.
USD/JPY Price Analysis: Technical outlook
The USD/JPY remains neutral-to-upward biased, as shown by the daily chart, though the effect of the Bank of Japan (BoJ) interventions has taken its toll on the major. Also, falling US Treasury bond yields are headwinds for the USD; therefore, further USD/JPY downside is expected.
From a technical perspective, the USD/JPY faces solid resistance at 146.90 and is struggling to extend its losses below the October 26 daily close at 146.37, which, if confirmed, would open the door for further losses. USD/JPY key support levels lie at the October 27 low of 145.10, followed by the 50-day EMA at 143.64, ahead of 140.00.
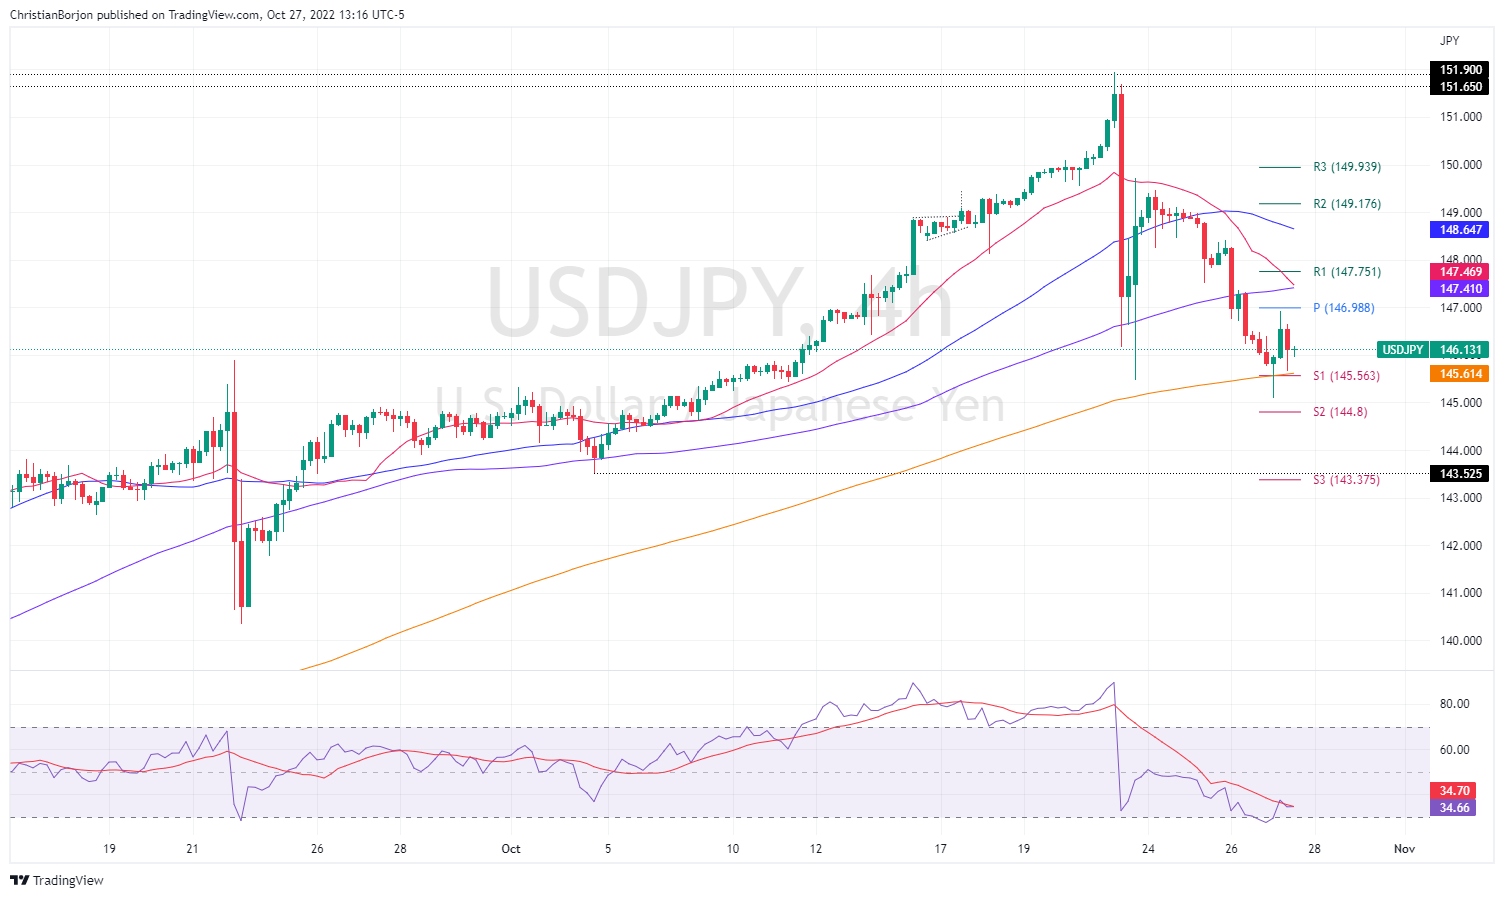
Short term, the USD/JPY four-hour chart suggests the pair is neutral-to-downward biased, unable to crack the 200-EMA at 145.61 on its first attempt in the Asian session. Worth noting that the USD/JPY tumbled to a fresh three-week low, so if the USD/JPY did not clear the last higher-high around 148.41, a re-test of the 200-EMA is on the cards.
Hence, the USD/JPY first support would be the S1 daily pivot at 145.56, followed by the 200-EMA at 145.61. Once that zone is cleared, the next support would be the S2 daily pivot point at 144.80, followed by 144.00, ahead of the S3 pivot level at 143.37.
USD/JPY Key Technical Levels